-
XSS.stack #1 – первый литературный журнал от юзеров форума
How Decompile Exe PE
- Автор темы 3xp0it
- Дата начала
u cant analyze pe file using dnSpy, dnSpy works with .Net assemblies
- Автор темы
- Добавить закладку
- #3
Пожалуйста, обратите внимание, что пользователь заблокирован
You are right. I'm Trying To Solve This, It's Very Difficult, How To Solve This, Do You Know?u cant analyze pe file using dnSpy, dnSpy works with .Net assemblies
Пожалуйста, обратите внимание, что пользователь заблокирован
Use IDA Pro or Ghidra to analyze native executables. And you can't decompile native code to the state that you could compile back, MSIL and native code are very different.You are right. I'm Trying To Solve This, It's Very Difficult, How To Solve This, Do You Know?
Пожалуйста, обратите внимание, что пользователь заблокирован
ilspy , dnspy is good for .net for native use IDA
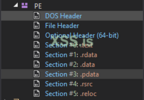
The executable in Windows OS contain a PE header, for .NET executables, the header makes calls to the CLR VM of the .NET.
dotPeek is a nice and free .NET Decompiler and Assembly Browser for these executables.
For No VM executables, I also use (except for IDA), the Olly debugger. It also has some handy plugins.
In addition, PE Tools could help on analyzing, it gives you the following functionality:
dotPeek is a nice and free .NET Decompiler and Assembly Browser for these executables.
For No VM executables, I also use (except for IDA), the Olly debugger. It also has some handy plugins.
In addition, PE Tools could help on analyzing, it gives you the following functionality:
- PE Editor
- File Location Calculator
- PE Files Comparator
- Process Viewer and Manager
- PE Dumper
- PE Rebuilder
- PE Sniffer
https://www.malwarebytes.com/blog/news/2014/05/five-pe-analysis-tools-worth-looking-at
Пожалуйста, обратите внимание, что пользователь заблокирован
What program do you use to crack exe files?How Dump Crack PE file Format Exe Program.
I Use See Code Using Dnspy
Sometimes you need to deobfuscate/devirtualize your exe file first. Then use Ghidra or anything.
Пожалуйста, обратите внимание, что пользователь заблокирован
Для ваших задач вполне подойдут Ghidra, Radare2, IDA(лучше PRO, но кое-что можно решать и не с PRO), OllyDBG, так же можно использовать WinDBG и GDB(умеет отлаживать COFF, а PE-всего лишь COFF с дополнительными заголовками). Помимо этого, есть PE Tools, там инструменты реверса дифференцированы по характеру задач и по назначению.
Последнее редактирование: