Due to privacy compliance issues, it is necessary to audit the involved third-party SDKs to prevent these SDKs from obtaining information that should not be obtained. However, conventional detection methods are limited and cannot monitor all methods used by SDKs.
As we all know, iOS APP can be debugged directly on a MAC using Apple chips. There are various tools for monitoring processes on Unix. At this time, we can use the tools on Unix to achieve our purpose.
For example, dtrace can monitor various system calls
The name of dtrace implies its own script. dtrace uses D language as the scripting language. Let’s briefly introduce the usage of dtrace.
If we want to monitor all syscall calls of a process, first, we need to create a file called syscall.d
where execname represents the process name
Run the sudo dtrace -s syscall.d script on the terminal. In this way, no matter whether the SDK calls a function or calls syscall, or calls svc, or even implicitly calls svc, it can be monitored by dtrace. You can also add ustack(); to the script. Print The call stack makes it easy to look up the call point, and you can use Baidu dtrace to extend the function.
There is also a useful tool in unix, opensnoop. opensnoop can monitor the file opening operation of a specific process. It is also implemented based on dtrace encapsulation.
Basic usage sudo opensnoop -n <process_name> where process_name is the name of the process that needs to be monitored
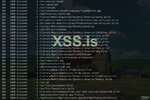
For example, if I randomly monitor an APP
You can see that the APP performs read and write operations on these files to detect jailbreaks, including common jailbreak file detection, frida detection, and new machine APP detection.
This article is just for reference, more operations can be expanded by yourself
As we all know, iOS APP can be debugged directly on a MAC using Apple chips. There are various tools for monitoring processes on Unix. At this time, we can use the tools on Unix to achieve our purpose.
For example, dtrace can monitor various system calls
The name of dtrace implies its own script. dtrace uses D language as the scripting language. Let’s briefly introduce the usage of dtrace.
If we want to monitor all syscall calls of a process, first, we need to create a file called syscall.d
Код:
syscall::read:entry
{
        printf ("%s called read, asking for %d bytes\n", execname, arg2);
}
where execname represents the process name
Run the sudo dtrace -s syscall.d script on the terminal. In this way, no matter whether the SDK calls a function or calls syscall, or calls svc, or even implicitly calls svc, it can be monitored by dtrace. You can also add ustack(); to the script. Print The call stack makes it easy to look up the call point, and you can use Baidu dtrace to extend the function.
There is also a useful tool in unix, opensnoop. opensnoop can monitor the file opening operation of a specific process. It is also implemented based on dtrace encapsulation.
Basic usage sudo opensnoop -n <process_name> where process_name is the name of the process that needs to be monitored
For example, if I randomly monitor an APP
You can see that the APP performs read and write operations on these files to detect jailbreaks, including common jailbreak file detection, frida detection, and new machine APP detection.
This article is just for reference, more operations can be expanded by yourself